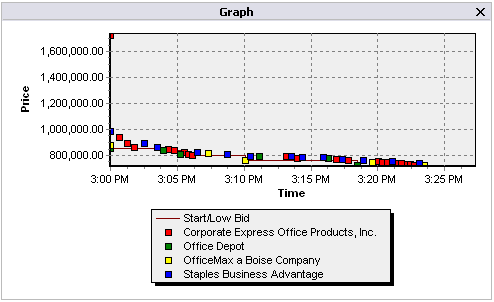
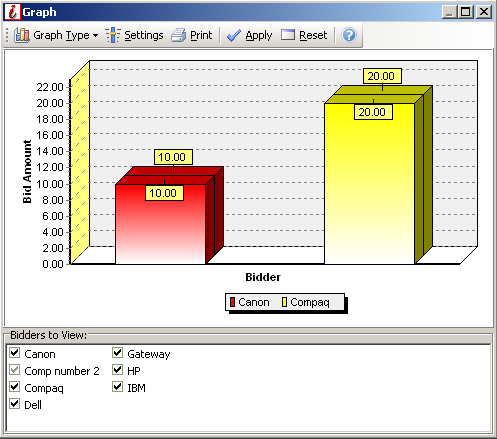
The default graph refreshes after each new bid is received and shows you how the project is progressing. You can edit options for graphs, resize the graph or switch to a bar graph representations.

»To work with live event graphs
- Click
 on the toolbar to open the Graph window.

Graph Window
- Use the following options to modify the graph:
 : Opens a menu allowing you select a line or bar graph style.
 : Increase or decrease graph settings such as depth, perspective, elevation, and rotation.
- Bidders to View: Select the check boxes of the bidders you want to appear on the graph.
- click
 to update the graph with modified settings or click
  to turn back your changes to default status.
Related Topics